Linux servers
See pending security updates, package versions, service failures and system health.
Explore details
INFRASTRUCTURE MONITORING & INVENTORY
See Windows and Linux system health, inventory and updates alongside switch, UPS and printer status.
Start free trial15 days · Up to 5 machines · No card needed
A product by Doz Teknoloji
Platforms
View server health and updates alongside the status of switches, UPS units and printers.
See pending security updates, package versions, service failures and system health.
Explore detailsMonitor switches, firewalls, UPS units and printers through an existing agent.
Explore detailsFeatures
View operating systems, updates, installed software, CPU, memory, disks and network adapters.
See low disk space, SMART disk alerts and machines that stop reporting. Receive critical e-mail alerts and a daily summary.
Track CPU, memory and network traffic for each machine, from the last hour to 90 days.
Check Windows and Office activation and compare installed software with the licences you own. Review Windows Server and SQL Server core counts.
View virtual machines, their state, memory, disks, checkpoints and replication.
Identify Windows, Office and SQL Server versions that are out of support.
See what changed on your machines and when.
Receive weekly and monthly PDF reports by e-mail.
Screenshots
See the screens behind inventory, performance, alerts and reporting. Select an image to open it at a larger size.
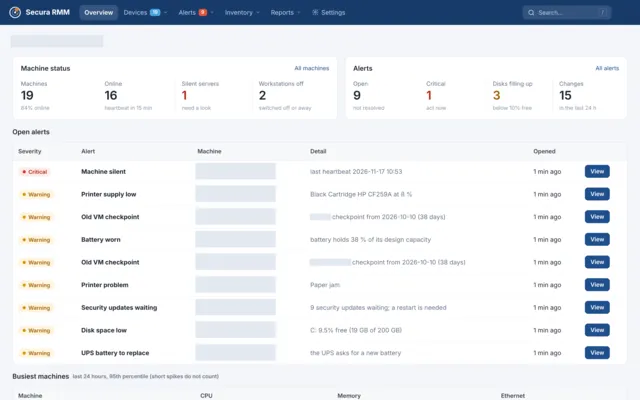
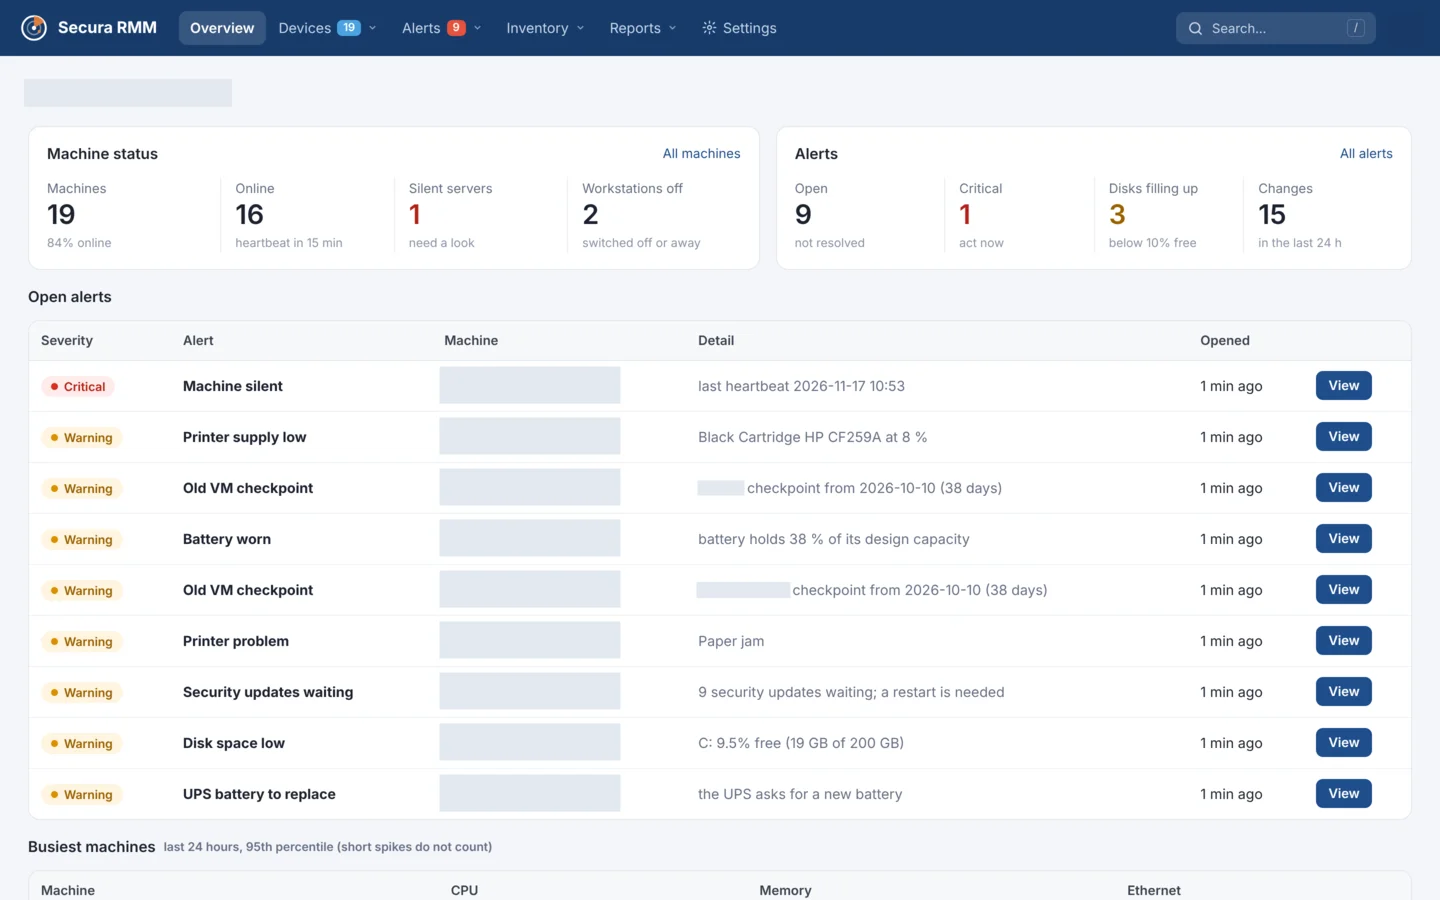
See machine status, open alerts and recent activity across the monitored fleet.
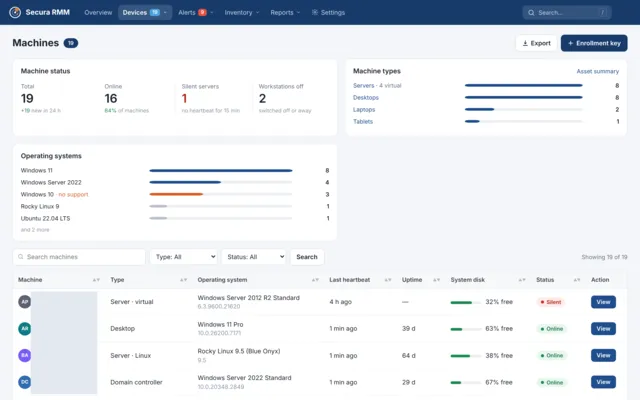
Filter machines by type or status and check operating systems, last contact and disk usage.
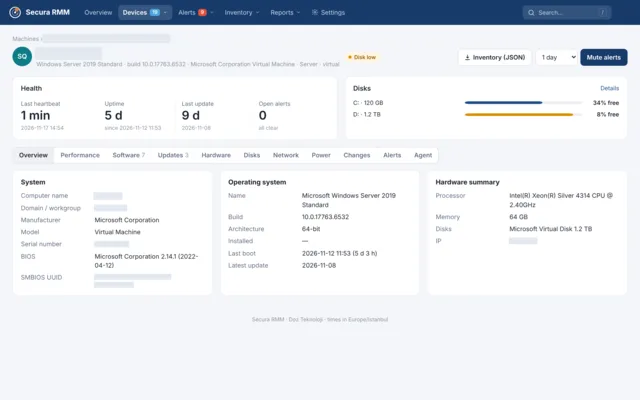
Review an individual machine’s health, disk usage, operating system and hardware summary.
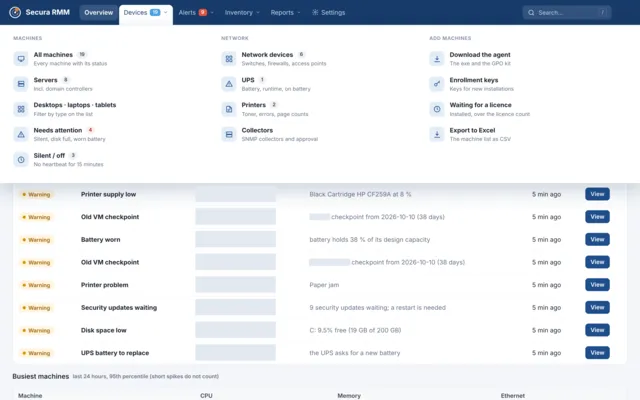
Open machine groups, network devices, UPS units or enrollment tools from the Devices menu.
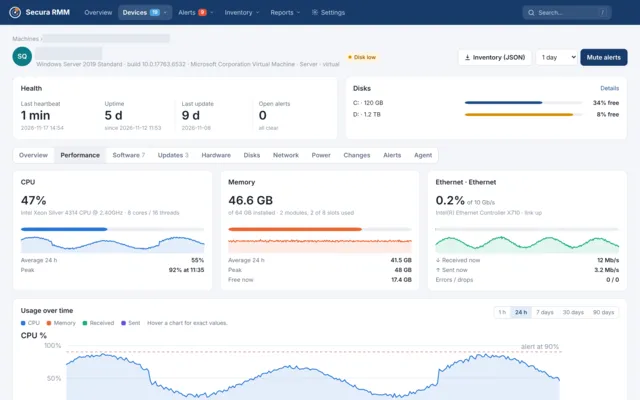
Review CPU, memory and network activity over time for a single machine.
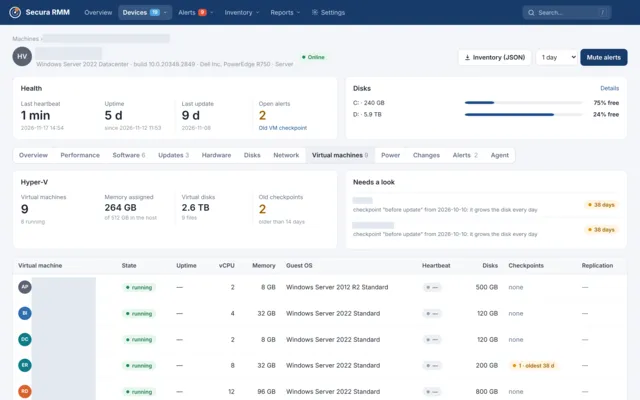
See virtual machines, resource allocations, checkpoints and replication status for a Hyper-V host.
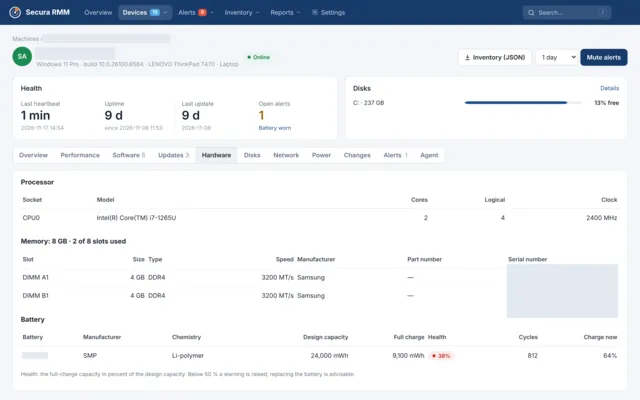
Compare current full-charge capacity with design capacity and check battery health and charge.
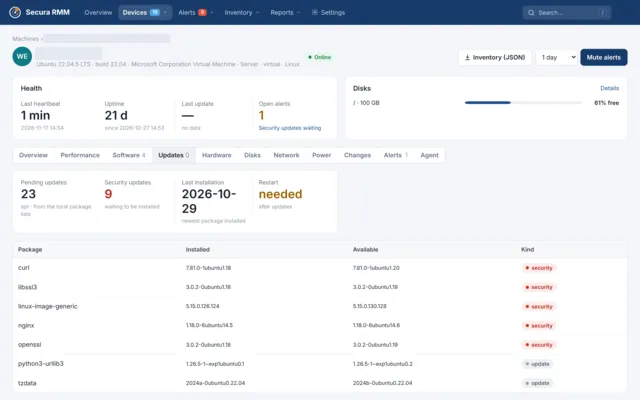
Review pending packages, security updates and the reboot indicator for an enrolled Linux machine.
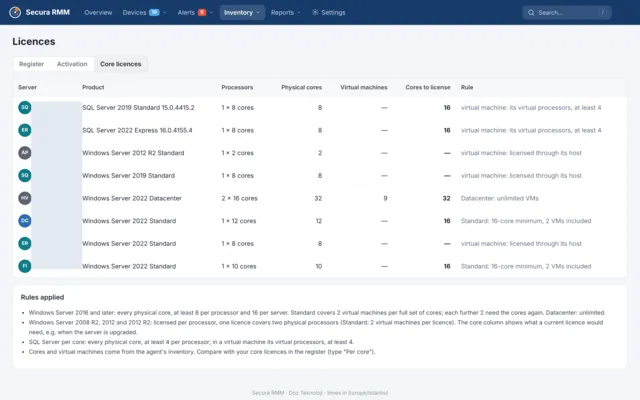
Review processor, physical core and virtual machine counts alongside Windows Server and SQL Server licensing estimates.
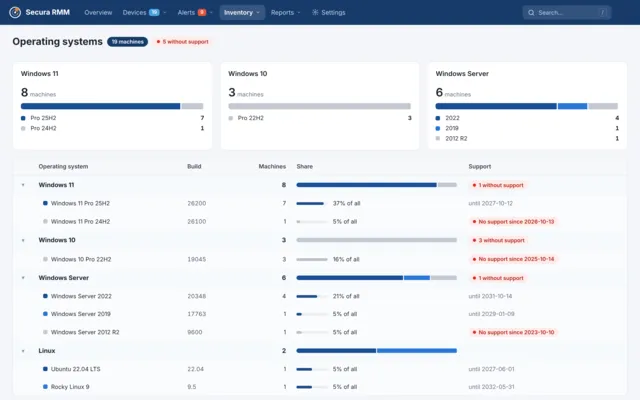
See operating system versions, device counts and end-of-support indicators.
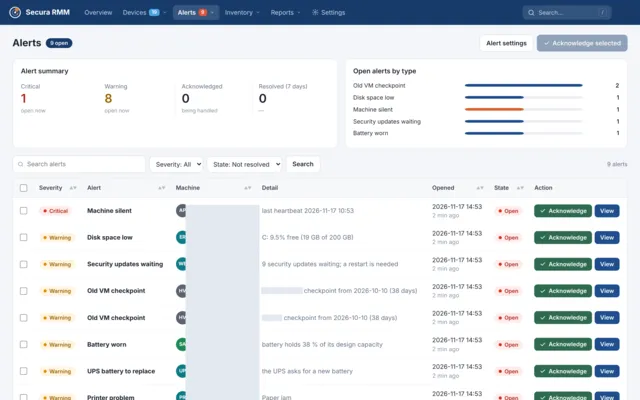
Review open alerts by severity and type, and see which alerts have been acknowledged.
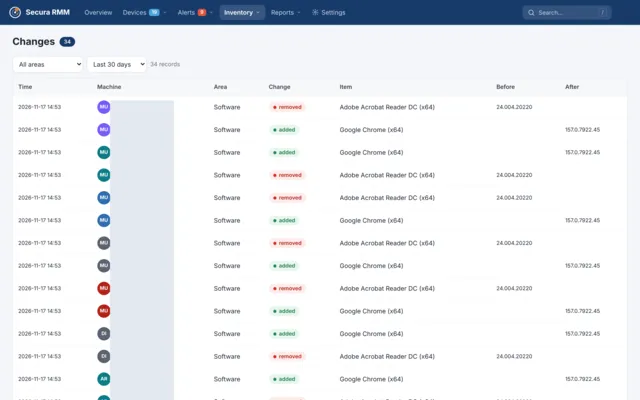
Track when software was added, removed or updated and compare versions before and after each change.
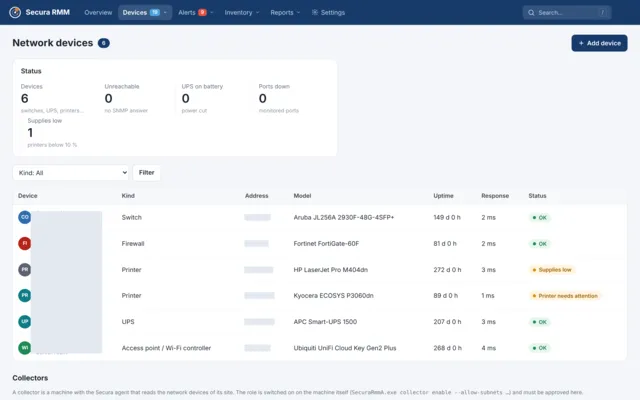
View monitored devices such as switches, firewalls, printers and UPS units alongside their status and response times.
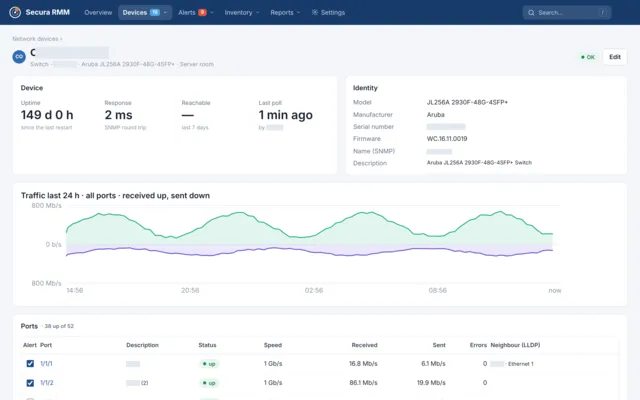
Check switch uptime, traffic over the last 24 hours and individual port activity.
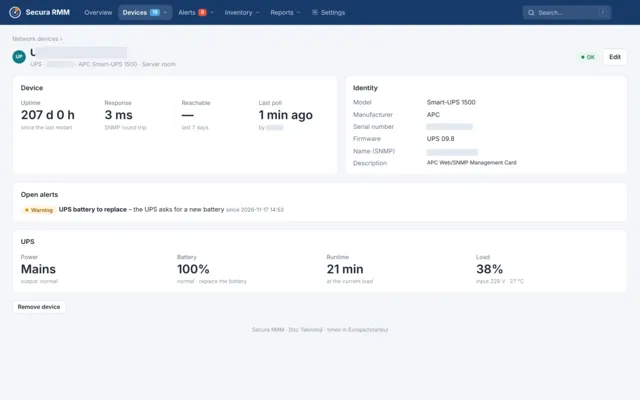
Check power source, battery charge, estimated runtime, load and open battery alerts.
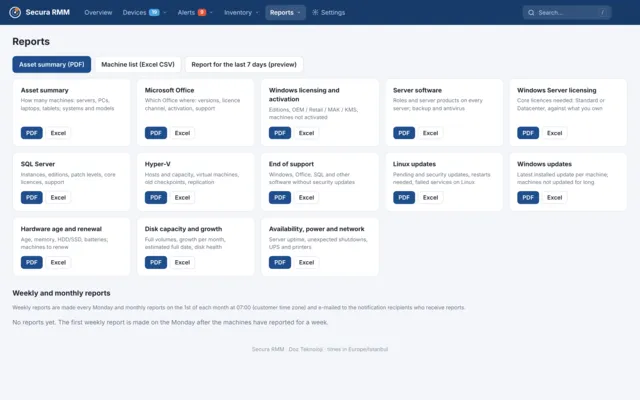
Browse report types and see the available PDF or spreadsheet export options for each report.
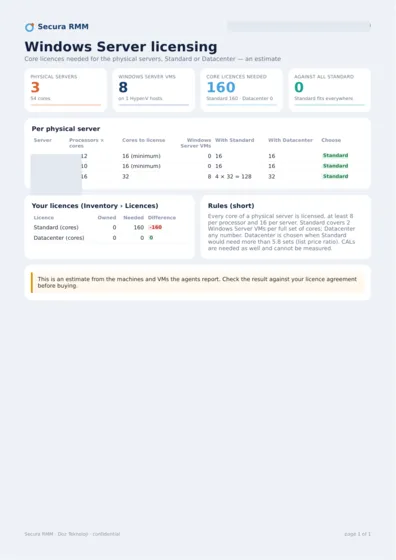
See how the PDF summarises physical servers, virtual machines and estimated Windows Server core licence requirements.
Security
The agent reads and reports inventory and health data. It does not run commands or change settings.
The agent connects out over HTTPS with TLS 1.2 or later.
Machine inventory is stored on Doz Teknoloji’s own server.
Each customer can access only their own machines.
Two-factor authentication and an audit log of administrative actions.
The agent is a lightweight Windows service.
How it works
Create your account and confirm your e-mail address.
Create an enrollment key in the panel. Install the agent manually on Windows or Linux, or use Group Policy (GPO) on Windows.
Your machines appear in the panel within minutes.
Windows Server 2012 R2 and Windows 8.1 or later are supported. See Platforms for Linux compatibility and network collector setup.
Pricing
One price for each Windows server or PC.
25 PCs + 3 servers = 28 machines
28 × USD 2 = USD 56 / month
USD 2per machine / month
After the trial: USD 2 per machine per month, paid monthly by card. Customers in Turkey: VAT included, charged in TRY at the CBRT rate. An invoice is issued every month. Trial accounts without a payment are deleted 15 days after the trial ends.